
The double top pattern. This pattern is perfect if you are a reversal trader of an uptrend. In this article, we are going help you identify these potential opportunities in the market and give you insight on how to play them. Using technical analysis we will give you tips and strategies on how to trade the double top pattern.
Whether you’re a seasoned trader or just starting out, understanding this powerful chart formation such as the double top or the double bottom pattern could be the key to unlocking profitable trades. Bookmark this page, grab your notepad and let’s dive in. These are the types of patterns we find and trade in our stock option services at Stock King Options.
Distinguish the Double Top
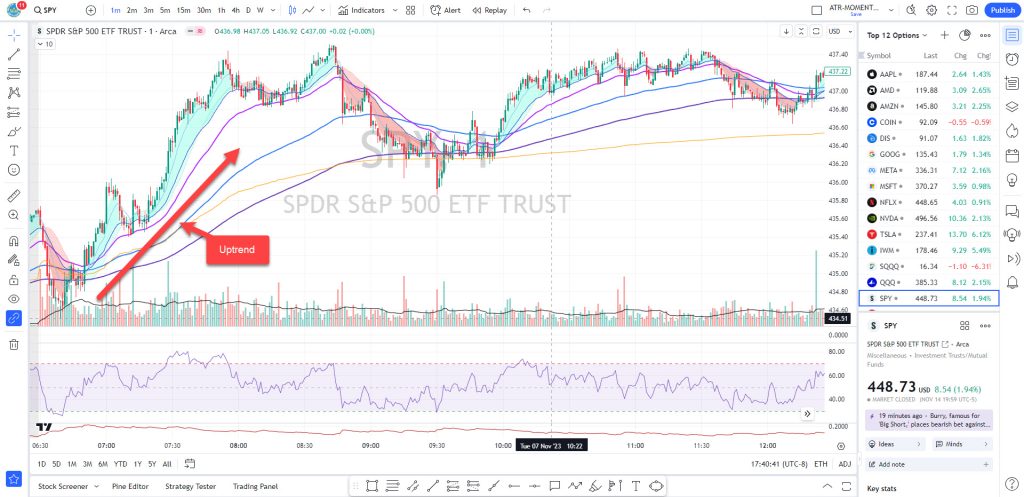
The double top pattern is a popular chart formation in technical analysis that signals a potential trend reversal of an uptrend. It consists of two consecutive peaks with a trough in between, forming the shape of an “M”. This pattern indicates that buyers have twice failed to push the price higher, leading to a shift in momentum. See the uptrend below.
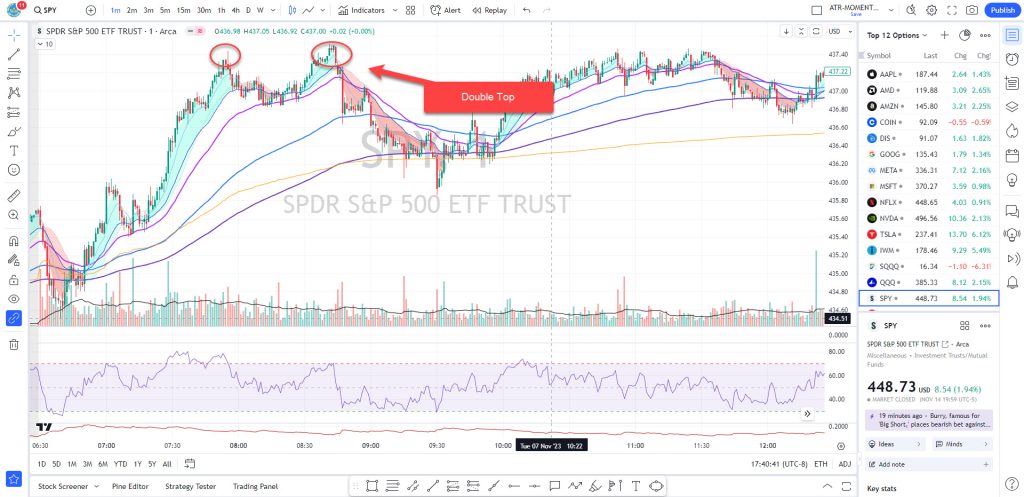
To distinguish the double top from other patterns, it’s important to look for specific characteristics. The two peaks should be approximately equal in height and occur after an uptrend. Additionally, there should be a noticeable decline in volume during the second peak, indicating weakening buying pressure.
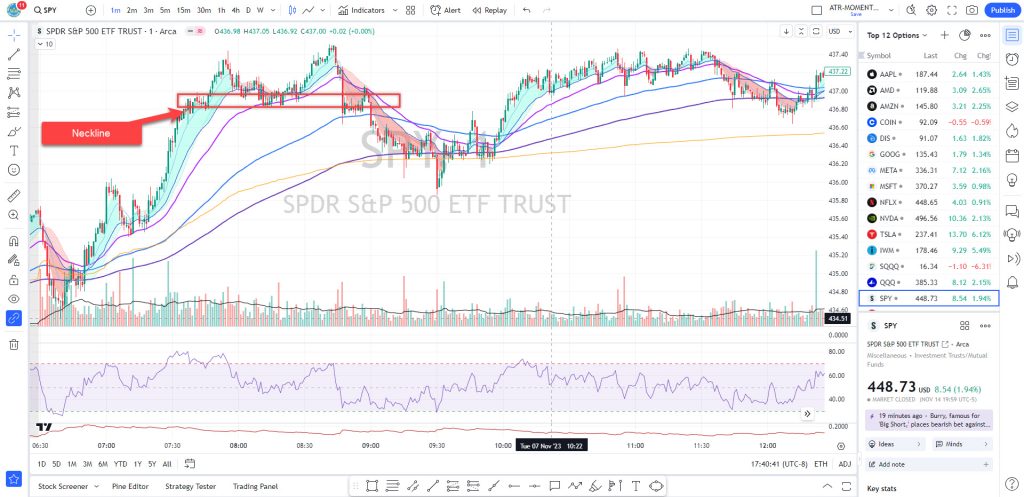
Traders can utilize various tools such as trendlines or moving averages to confirm the validity of the pattern. Drawing a neckline by connecting the lows between the two peaks can provide additional confirmation when broken.
It’s worth noting that patience and attention to detail are key when identifying this pattern. It may take some time for it to fully develop on your charts, so don’t rush into trades prematurely.
Mastering how to distinguish the double top is crucial for traders who want to capitalize on potential reversals and profit from market swings. We highly recommend using TradingView to chart as they’re very responsive and have a clean chart setup. By recognizing this pattern early on, you can position yourself strategically and make informed trading decisions based on its implications. So keep an eye out for those twin peaks – they could hold valuable trading opportunities. The double top pattern will be two tops as shown here on the 1 min time frame. You can also move up to the 5 min time frame to see a more condensed view.
Double Top Pattern: Entry Signal
Identifying the entry signal for a double top pattern is crucial to successful trading. Once you have identified the formation of a double top, there are certain key indicators that can help confirm your entry point.
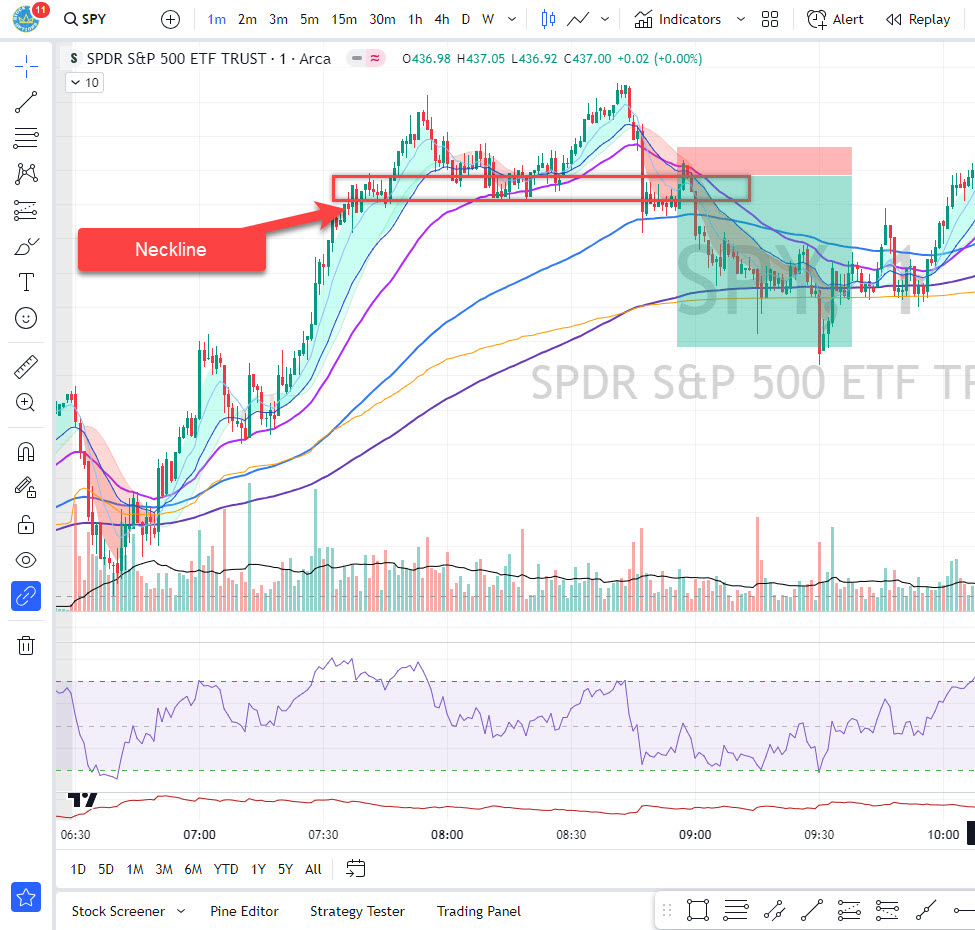
The first thing to look for is a break below the neckline. The neckline is formed by connecting the lows between the two peaks of the double top pattern. When price breaks below this level, it signals a potential reversal and presents an opportunity to enter a short trade. See the neckline of our example below:
Another confirmation signal to watch out for is an increase in selling volume as price approaches or breaks below the neckline. This suggests that market participants are starting to sell off their positions, adding weight to the bearish case.
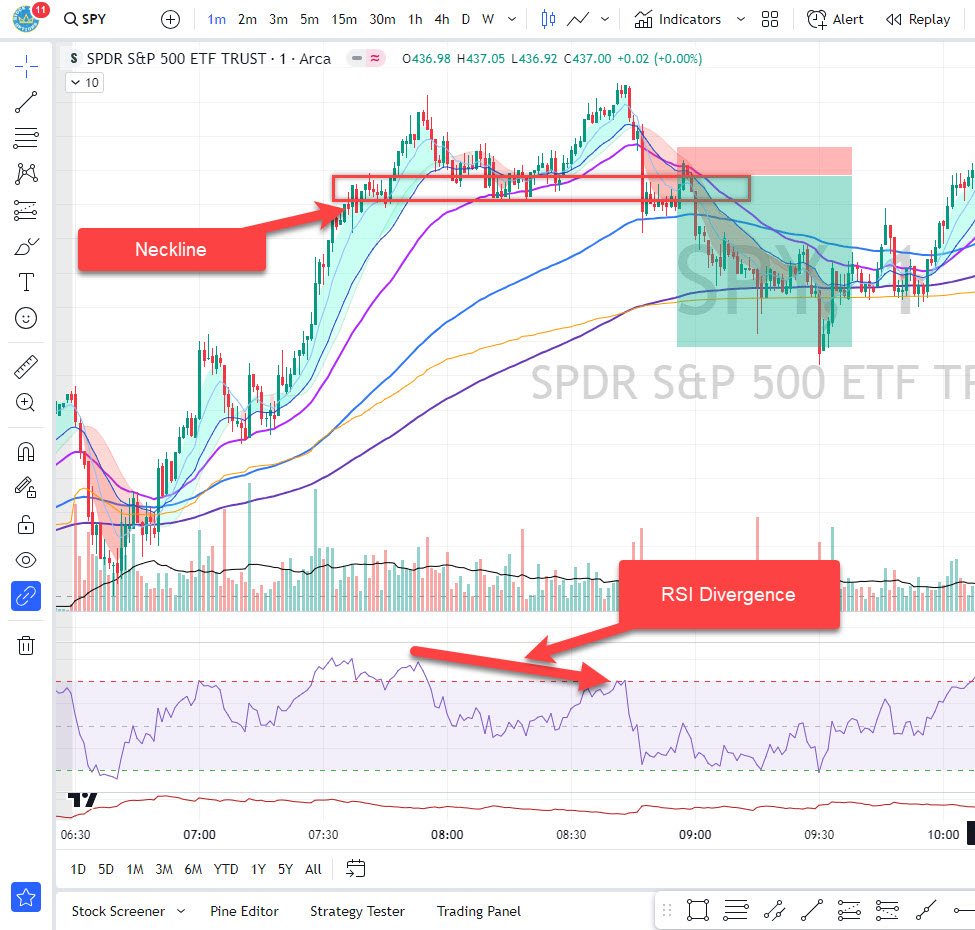
Additionally, traders often use oscillators like RSI (Relative Strength Index) or MACD (Moving Average Convergence Divergence) to identify overbought conditions when price reaches the second peak of the double top pattern. If these indicators show divergence or start moving downwards, it indicates weakness in buying momentum and serves as another potential entry signal.
Remember that no single indicator should be relied upon solely; it’s important to analyze multiple factors and wait for confluence before entering trades based on double top patterns. By doing so, you increase your chances of success and minimize false signals. Always wait for the breakout of the double top pattern/
As with any trading strategy, risk management is paramount when entering trades based on double tops. It’s advisable to set stop-loss orders slightly above the second peak of the pattern or at a logical resistance level within close proximity. This way, if price reverses and breaks above these levels, it invalidates your trade setup and helps limit potential losses.
In conclusion, the entry signal for trading a double top pattern involves waiting for confirmation through various technical indicators such as breakouts below necklines, increased selling volume, and divergences in oscillators like RSI or MACD. Remembering proper risk management techniques by setting appropriate stop-loss orders is crucial to protect your capital. By understanding and utilizing these entry signals.
Double Top Pattern Risk to Reward
When trading the double top pattern, it’s important to consider the risk to reward ratio. This ratio helps determine if a trade is worth taking or not. The risk refers to how much you stand to lose if the trade goes against you, while the reward is the potential profit you could make if the trade goes in your favor.
With any trading strategy, there will always be risks involved. The double top pattern is no exception. One of the main risks with this pattern is that it can sometimes lead to false breakouts or failed reversals. This means that even though a double top may form and indicate a potential reversal, price could still continue higher instead of reversing lower.
To manage this risk, it’s crucial to set proper stop loss levels when trading the double top pattern. A stop loss order should be placed just above the highest point of resistance in order to protect yourself from significant losses if price breaks out above that level.
On the other hand, when considering potential rewards with this pattern, traders often look for a target equal to at least twice their initial risk. For example, if your stop loss level is set at at least 2 to 1 risk to reward ratio from the neck line break. This is where your take profit level should be set at minimum.
By carefully managing both your risk and reward when trading double tops patterns, you can increase your chances of success and minimize potential losses along the way.
Double Top Pattern: Stop Loss
When trading the double top pattern, it’s crucial to have a solid risk management strategy in place. One important aspect of this is determining where to set your stop loss. The stop loss is essentially a predetermined level at which you will exit the trade if it moves against you.
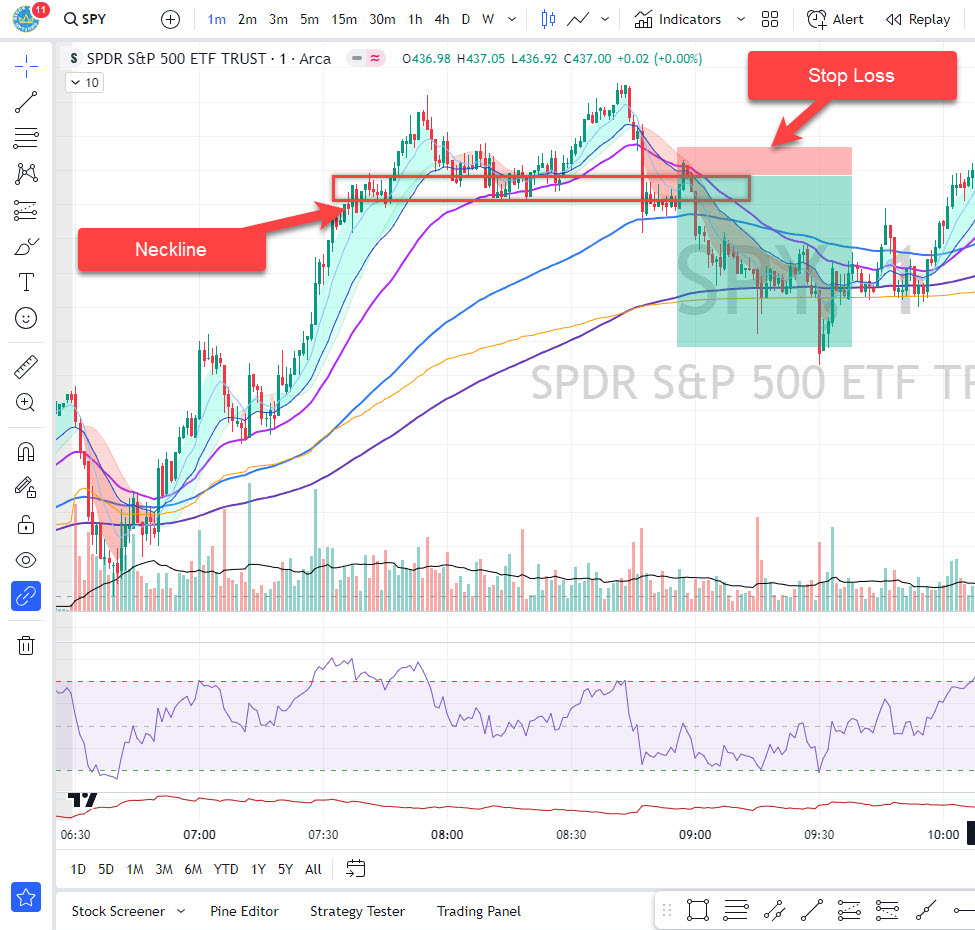
To set an effective stop loss for a double top pattern, you need to consider the height of the pattern and potential price targets. A common approach is to set the stop loss just above the highest point of the double top formation. This allows for some room for minor fluctuations while still protecting your capital if price breaks out above that level.
Another factor to consider when setting a stop loss is market volatility. If there has been recent volatility or if you’re trading on a shorter time frame, it may be wise to give your trade more breathing room by setting a wider stop loss.
It’s important not to set your stop loss too tight, as this can lead to premature exits and missed opportunities. On the other hand, setting it too wide can expose you to larger losses if price reverses unexpectedly. A good rule of thum is to place it a bit above the neckline to allow the price action to move. See below as an example:
By carefully considering these factors and using technical analysis tools such as support and resistance levels, moving averages, or trend lines, you can determine an appropriate placement for your stop loss when trading the double top pattern. This will help protect your capital while allowing for potential profits from successful trades.
Take Advatage of the Double Top Pattern
Once you have identified a double top pattern, it’s time to take advantage of this powerful reversal signal. By understanding how to trade the double top pattern effectively, you can increase your chances of making profitable trades.
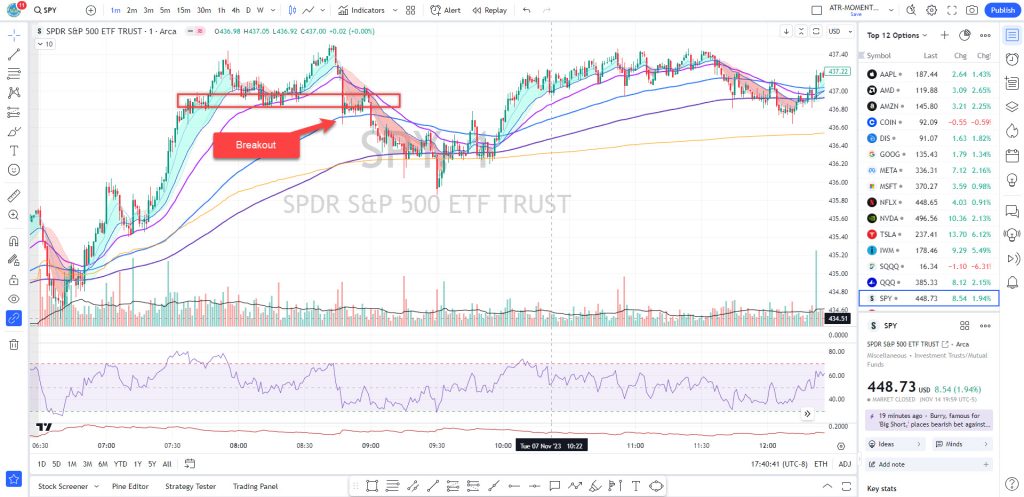
One way to capitalize on the double top pattern is by entering a short trade when prices break below the neckline. This confirms that sellers have taken control and further downside movement may be expected. It is important to wait for this confirmation before entering a trade additionally enter when you candle stick pattern is shown, as false breakouts can occur. See the move down from the double top example below:
A cruicial tip on validating a double top pattern is to use the RSI as confirmation. You can use the RSI at the two peaks of the double top to find any divergence. If divergence is shown, this shows weakness at the 2nd top which validates the double top pattern.
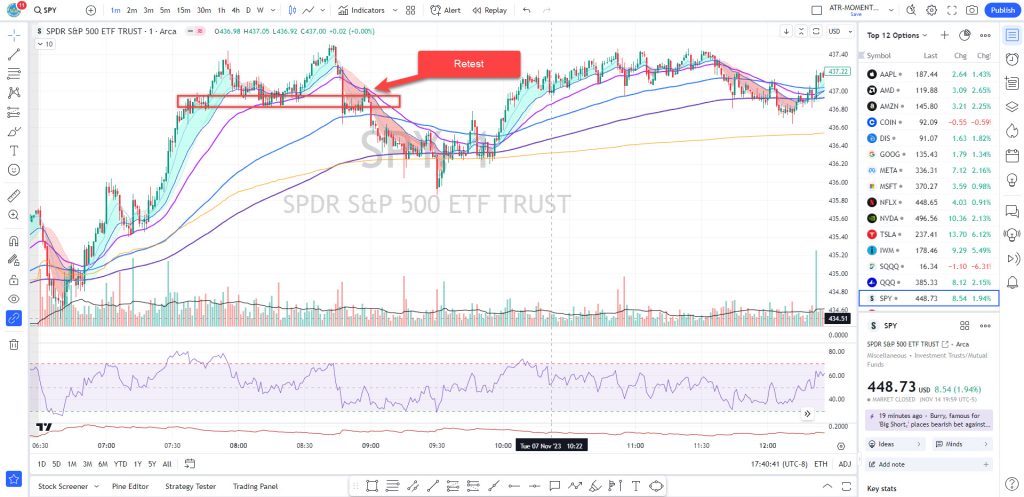
When trading the double top pattern, it’s crucial to assess risk-to-reward ratios carefully. Determine your profit target based on historical price action or areas of support where price may potentially reverse. By setting realistic profit targets and managing your risk properly to can take advantage of this double top pattern. Additionally, you can be an aggressive trader and enter via the breakout or you can be more conservative and wait on the retest of the neckline.
To protect yourself from significant losses if the market doesn’t follow through with the expected reversal, it’s essential to set a stop loss order just above the neckline high after confirming the formation of a double top pattern. This allows you to exit quickly if prices continue higher instead. The neckline is not actually a line but a zone.
Remember that not all double tops will result in successful reversals; some may fail or lead only to minor retracements before continuing their prior trend. Therefore, always keep an eye on other factors such as overall market conditions and fundamental news events that might influence price movements.
Mastering how to trade the double top pattern requires patience and careful analysis but can provide rewarding opportunities when executed correctly. Don’t forget about proper risk management and using additional confirmation tools alongside this technical analysis tool for increased accuracy in your trading decisions.
Summary
Trading the Double Top pattern can be a profitable strategy for technical analysts and traders alike. By understanding how to identify this pattern, entry signals, risk-to-reward ratios, and setting appropriate stop losses, you can take advantage of potential trend reversals and maximize your profits.
To distinguish the Double Top pattern, look for two consecutive peaks at approximately the same price level, separated by a trough in between. This formation indicates that buyers are struggling to push prices higher beyond a certain resistance level.
Once you have identified the Double Top pattern, wait for confirmation before entering a trade. Look for a break below the neckline or support level as an entry signal. This confirms that selling pressure is overcoming buying pressure and validates the potential reversal. Take advatage of the move to the downside.

Risk management is essential when trading any pattern. Determine your risk-to-reward ratio by calculating the distance from the top of each peak to the neckline or support level. Ensure that your potential profit outweighs your possible loss before taking any trades based on this pattern.
Setting an appropriate stop-loss order is crucial to protect yourself from excessive losses if price action does not follow your anticipated direction. Place your stop-loss slightly above the neckline of the Double Top formation to minimize risks while allowing room for normal market fluctuations.
By mastering these techniques related to trading double tops patterns effectively, you can enhance your overall trading skills and increase profitability in financial markets where such trends appear regularly.
Remember that technical analysis serves as a guide but cannot guarantee success every time. It’s always important to combine it with other forms of analysis and use proper risk management strategies tailored to individual preferences.
So keep honing your skills, stay disciplined in managing risks, and continuously learn from both successes and failures along your trading journey! Happy trading!
Note: Trading involves substantial risk; always seek professional advice before making any investment decisions based on patterns or technical analysis alone.