Double Bottom Pattern: Full Strategy
Unlocking the secrets of successful trading can sometimes feel like cracking a complex code. But fear not, fellow traders, for today we are unraveling one of the most powerful patterns in technical analysis – the double bottom pattern.
This pattern has been known to produce substantial gains for those who can identifiy the price action, execute the entry, and manage the position.
Open up your charts on tradingview.com and get ready to dive into the world of double bottoms as we explore where they occur, how to draw them, and most importantly, how to trade them for consistent profit.
Whether you’re a seasoned trader or just starting out on your financial journey, this article will equip you with all the knowledge you need to master this pattern using technical analysis. Let’s begin our learning about the double bottom pattern. We use this pattern constantly to call out stock option signals within our stockkingoptions.com signal service.
Where Does the Double Bottom Typically Occur
Where does the double bottom typically occur? The double bottom pattern is a reversal formation that occurs after an extended downtrend. Picture this: prices have been dropping in a trending market, and finally reaches a price level of interest.
Suddenly, the bulls take over as the selling pressure subsides and buyers start to regain control. This is where the the double bottom pattern starts to occur. See an example below on the 5 min chart pattern for SPY.
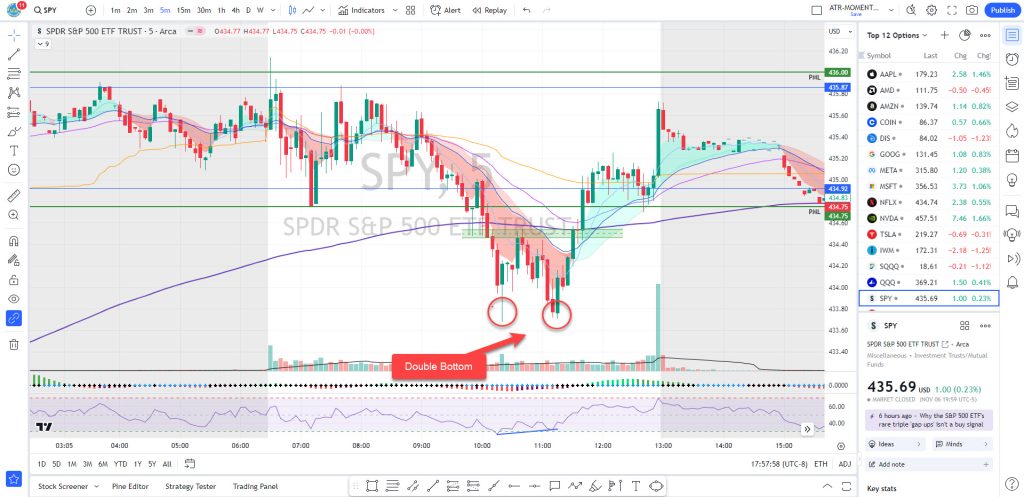
The first bottom forms at the end of the downtrend, marking a temporary support level. However, it’s not until prices rally and then retreat once again that we see our second bottom taking shape.
These two bottoms create a distinct W-like pattern on your chart – a visual representation of accumulation and potential trend reversal.
But wait! Where exactly do these magical double bottoms tend to appear? Well, my fellow traders, they often materialize near key support levels or previous areas of strong demand or strong level of bullish price level interest.
Think about it: when prices reach these significant levels for the second time and bounce back up, it signals increased buying interest and suggests that sellers are losing the battle to break the support.
One of the key’s is to look for these crucial support levels where market sentiment can shift dramatically and hold a trending market because in those moments lies your opportunity to spot and trade the double bottom pattern.
How to Draw the Double Bottom Pattern Neckline
Drawing the neckline of a double bottom pattern is an essential step in identifying and confirming this bullish reversal pattern. The neckline serves as a guideline for traders, indicating when the price has broken above resistance and confirmed that a double bottom formation is valid.
To draw the neckline, begin by connecting the highest points between the two bottoms of the pattern. These points should form a horizontal line or have a slight upward sloping angle.
It’s important to note that drawing an accurate neckline requires precision and attention to detail. This will confirm the double borrom formation. See the example on SPY on the 5 min timeframe below:
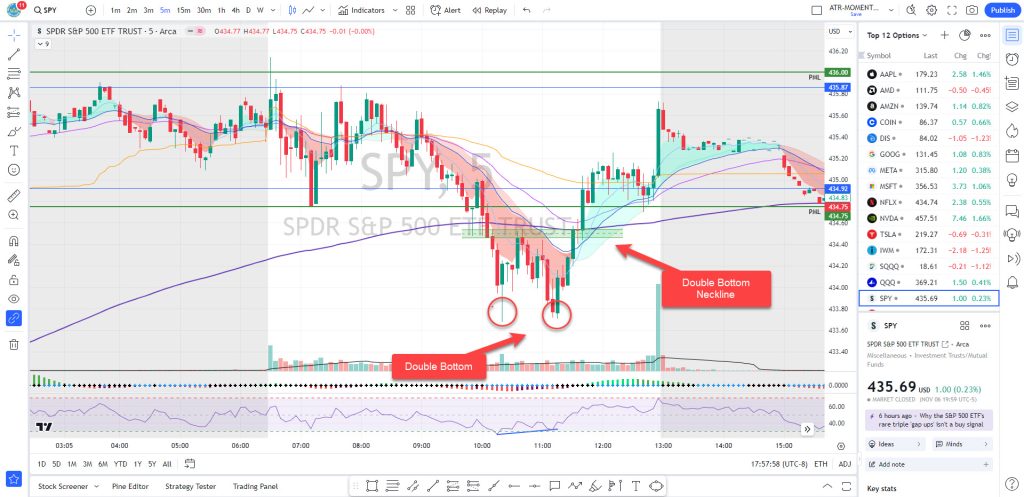
Once you have drawn the initial line connecting the tops, it’s time to refine your analysis. Look for additional swing highs or areas of resistance that align with your first drawn line. This helps create a more reliable and robust neckline. Protip on drawing the neckline, it is a zone not a line.
Remember, not all double bottoms will have perfectly symmetrical necklines. In some cases, there may be minor variations in slope or shape. What matters most is identifying clear support turned resistance levels where buyers overcame selling pressure.
By accurately drawing the double bottom neckline, you can better gauge when it’s time to enter into long positions and take advantage of potential bullish momentum in the market.
Double Bottom Entry
Entering a trade based on the double bottom pattern can be an opportune moment to capitalize on a potential reversal. The double bottom entry strategy involves waiting for confirmation of the pattern before entering the market.
To enter a trade using the double bottom pattern, traders typically wait for price to break above the neckline of the formation. This is considered confirmation that buyers have gained control and that an upward move is likely to follow.
Waiting for this breakout helps reduce false signals and increases the probability of a successful trade. Once it starts trading above the neckline is an opportune time to get into the trade. See entry below:
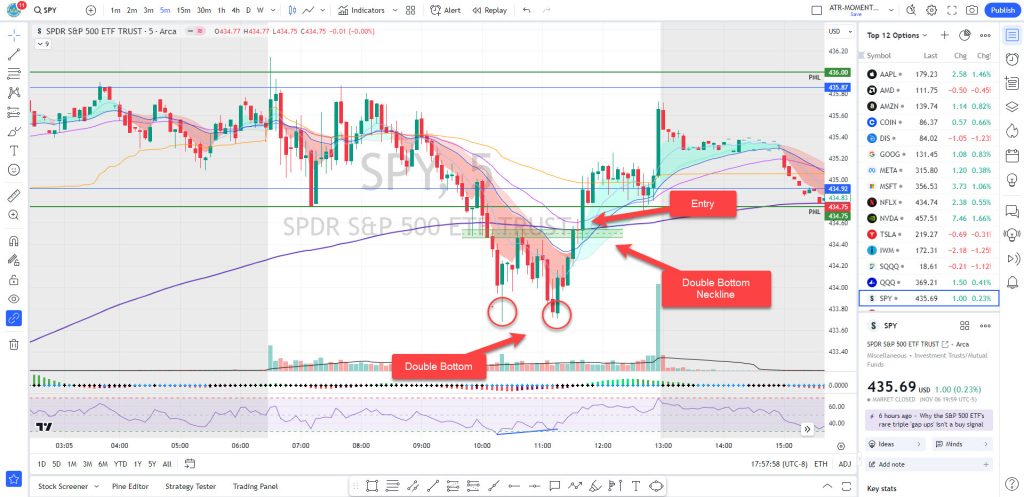
Traders often use additional indicators or tools, such as volume analysis or oscillators, to further confirm their entry decision. These can provide additional insights into market sentiment and help validate the strength of the expected reversal.
We will discuss how we validate the double bottom pattern with the RSI indicator later in this article. It’s important to note that timing is crucial when entering a trade based on the double bottom pattern.
Traders should wait patiently for all necessary conditions to be met before executing their entry order. Rushing into trades without proper confirmation can lead to unnecessary losses.
Once you have identified a valid double bottom pattern and confirmed its breakout, it’s time to take action and enter your position with confidence. You can enter the trade at the breakout as an aggresive trader or wait for the retest of the neckline level lower risk for complete validation.
The only thing if you wait for the break and retest is that at time the price wont retest the level. If that’s how price action goes, this is a case where you can completely miss the trade, so it comes down to if you are a aggressive or lower risk trader.
Remember, patience and discipline are key when trading any chart pattern, including the double bottom pattern.
Double Bottom Take Profit
When trading the double bottom pattern, it is essential to have a plan in place for taking profits. After all, what’s the point of identifying this bullish reversal pattern if you don’t know when and how to capitalize on it?
One common approach to setting a take profit level for a double bottom trade is by measuring the distance between the neckline and the highest peak of the pattern. Once you have determined this distance, you can project it upwards from the breakout point.
Another method traders use is to set their take profit at a predetermined target based on previous price levels or key support/resistance areas. This approach takes into consideration historical price action and can help identify potential areas where buyers might start taking profits.
It’s also important to consider your risk-to-reward ratio when deciding on your take profit level. Ideally, you want your potential reward (take profit) to outweigh your risk (stop loss) by at least two or three times. This ensures that even if some trades are unsuccessful, overall profitability can still be achieved.
Remember that there is no one-size-fits-all answer when it comes to determining your take profit level for a double bottom trade. It ultimately depends on factors such as market conditions, timeframes being traded, and individual risk tolerance.
By having clear guidelines in place for taking profits in double bottom trades, you can improve your chances of maximizing returns and making informed decisions based on objective analysis rather than emotions or guesswork alone.
Double Bottom Exit
Knowing when to exit a trade is just as important as knowing when to enter. When trading the double bottom pattern, there are several approaches you can take for your exit strategy.
One option is to set a profit target based on the height of the double bottom pattern itself. Measure the distance from the lowest point of the pattern (the neckline) to the highest peak and then project that same distance above the breakout level. This gives you a potential target for taking profits.
Another method is to use trailing stops. As price moves higher after breaking out of the neckline, you can adjust your stop loss order accordingly, locking in profits along the way. Trailing stops allow you to stay in a winning trade while still protecting yourself from potential reversals.
Some traders also choose to exit their position if certain technical indicators or patterns suggest a reversal may be imminent. This could include bearish candlestick patterns or overbought conditions on oscillators such as RSI or Stochastic.
Determining your exit strategy will depend on your trading style and risk tolerance. It’s important to have a plan in place before entering any trade so that emotions don’t cloud your judgment during market fluctuations.
Remember, successful trading involves both managing risk and maximizing profits. So make sure you have an exit plan for your double bottom trades and stick with it!
Risk to Reward with the Double Bottom
When trading any pattern, it’s crucial to consider the risk-to-reward ratio. The double bottom is no exception. By understanding this ratio, you can make more informed decisions and manage your trades effectively.
To calculate the risk-to-reward ratio for a double bottom trade, you need to determine your entry point (stop loss) and your take profit level. The stop-loss order should be placed below the neckline of the pattern, while the take profit level can be measured by projecting an equal distance from the neckline to the bottoms of the formation.
There is a tool for this on tradingview that you can use to help you monitor your trades. See an example below:
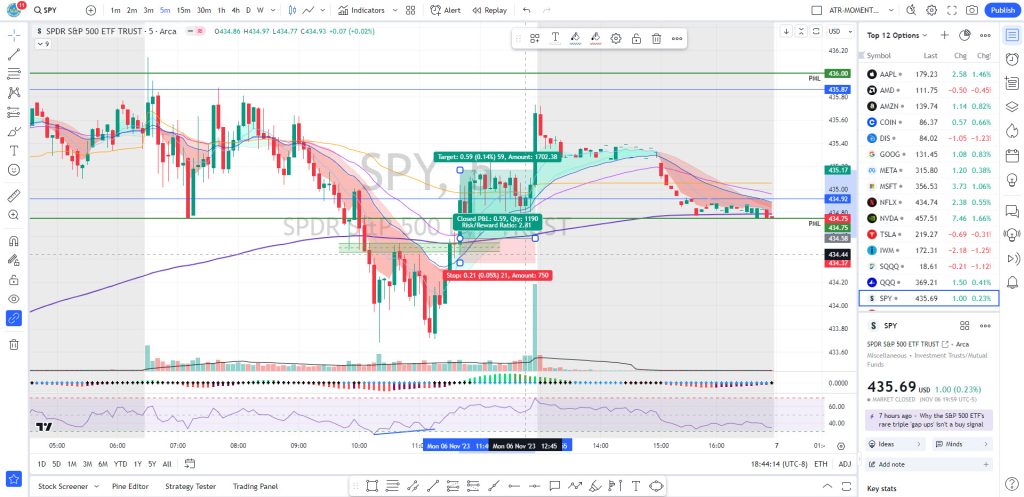
Ideally, you want a risk-to-reward ratio of at least 2:1 or higher.This means that for every dollar you are willing to risk on a trade (your stop loss), you aim to make at least two dollars in potential profit (your take profit). In our example, you can see that the risk to reward is 2.81 to 1 (2.81:1).
By having a favorable risk-to-reward ratio, even if not all of your trades are winners, you can still come out profitable in the long run. It allows you to have more flexibility when managing your trades and minimizes losses when they occur.
Keep in mind that there is no guarantee that every double bottom trade will be successful. Like any trading strategy or pattern, it comes with its own risks and uncertainties. It’s important to always use proper risk management techniques such as setting appropriate stop-loss orders and not risking more than a small percentage of your account balance on each trade.
Double Bottom RSI Confirmation – The Key
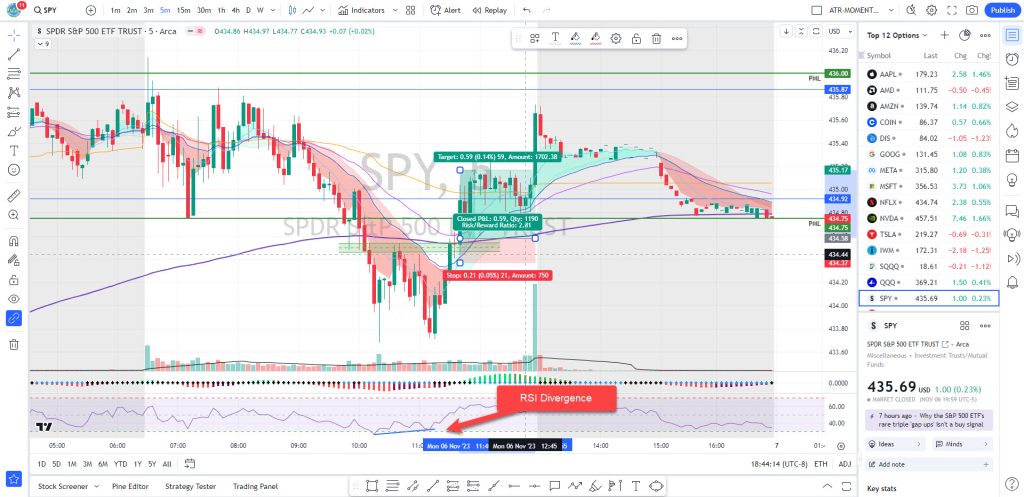
Our key to indentifying the double bottom pattern is using the RSI indicator. When we see the price has held at a previous level after a downtrend, we immediately look at the RSI to validate the double bottom.
If the RSI is showing divergence this is a key indication that the second bottom of the double bottom has a weaker strength therefore validating the double bottom. See the example below:
Conclusion
The double bottom pattern is a powerful tool for traders looking for potential trend reversals or bullish opportunities when using technical analysis. By identifying where these patterns typically occur and learning how to draw their neckline correctly, traders can increase their chances of making successful trades using this pattern.
Remember that patience is key when trading double bottoms. Wait for confirmation before entering positions and always consider other technical indicators or fundamental analysis alongside this charting pattern.
As with any trading strategy or system, practice and experience will help you become more proficient in identifying and trading the double bottom pattern.


